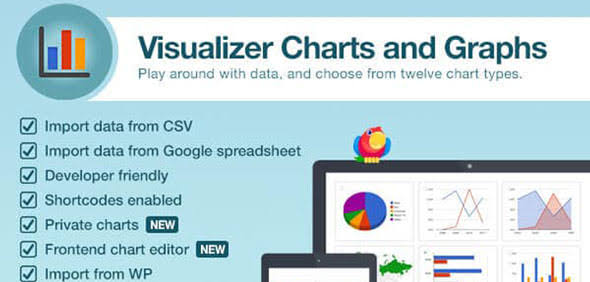
The Visualizer Charts and Graphs Plugin is a powerful data visualization tool that allows you to create stunning charts and graphs on your WordPress website. With this plugin, you can easily create interactive charts and graphs using a drag-and-drop interface, without any coding knowledge. Its features include 10+ chart types, custom colors and fonts, responsive design, and the ability to import data from Excel or Google Sheets. Plus, it’s fully compatible with all WordPress themes and plugins.
Visualizer Charts and Graphs Plugin 1.9.5
Rs2921 Rs99
- • All products come under GPL License, Means Unlimited Domain use.
- • 100% Free From Virus / Malicious Script / Backdoor
- • We purchase and Download from Original Authors.
- • The same products as vendor’s offer on their official website, but we don’t offer any additional author services like author’s and license keys For All Products. (Read our FAQ for more Info.)
You Can Download This Plugin For Free If You Purchase Any Membership Which Are Mentioned Below…
☑️ One Day Pass Membership
☑️ 1 Month Membership
☑️ GplMojo Club Membership
☑️ 1 Year Membership
☑️ Lifetime Membership
> Before making a purchase, please read Refund Policy in the Terms & Conditions & Privacy Policy.
> If you have any questions, please first read the FAQ.
> If you haven’t found the answer to your question, please contact us,we will response at our business hours.
> For any single items purchase you can download the product after payment by a direct link on your Downloads sections. For MEMBERSHIPS you will find a direct download button on all single item pages.
> Please note that any digital products presented on the website do not contain malicious code, viruses or advertising.
> We are not affiliated or in any way related to third-party developers or trademark owners. If you want to know more about GNU / GPL License, Check Help Page.


